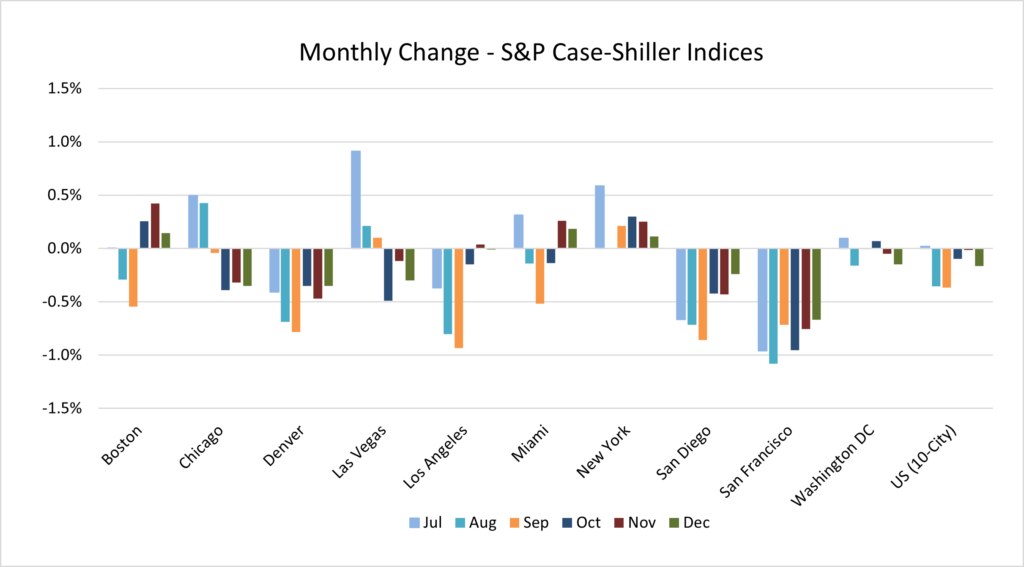
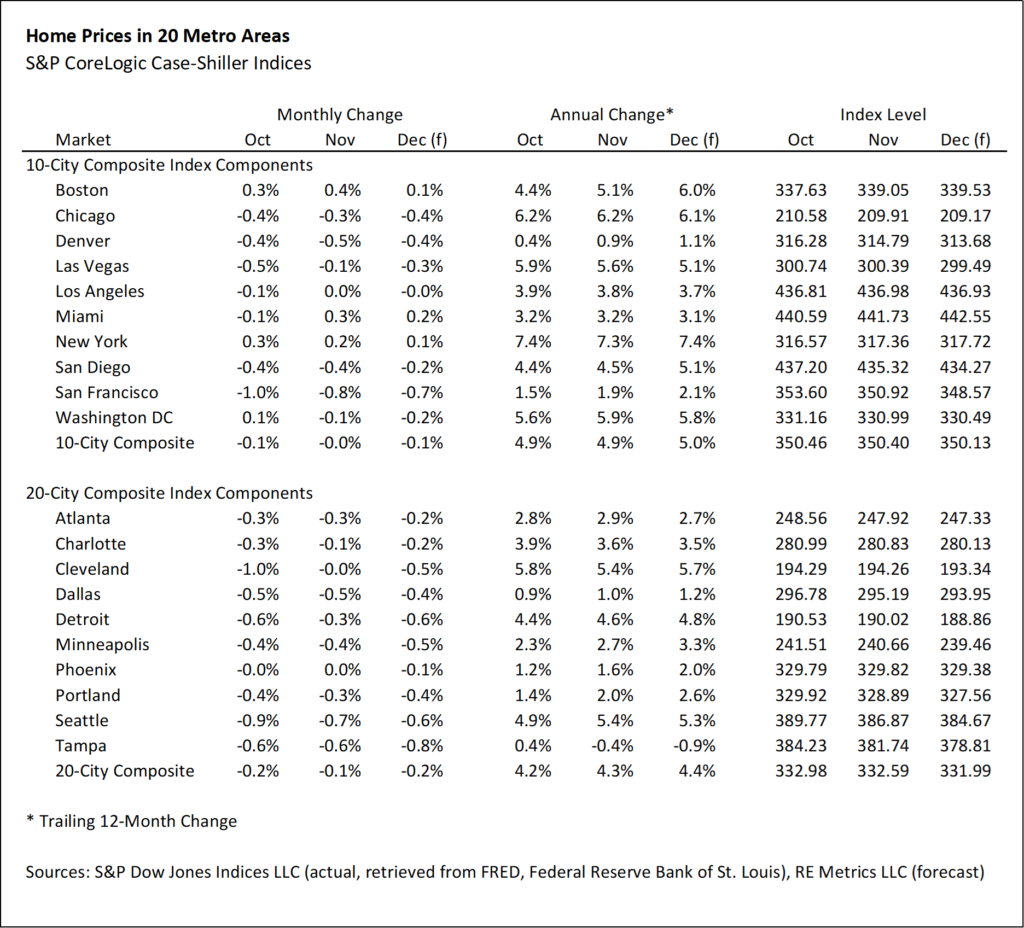
Home prices fell in December, with price declines in most markets outweighing increases in a few markets. RE Metrics’ estimate for December home prices (US 10-City Index) is negative 0.08%, slightly wider than the 0.02% monthly decrease in November. According to RE Metrics’ model, prices declined in seven of the ten metros during December. The largest month-to-month declines were in San Francisco (-0.7%), Chicago (-0.4%) and Denver (-0.4%). Three markets posted price growth: Miami (0.2%), Boston (0.1%) and New York (0.1%).
Most metros experienced weaker conditions in December compared to November. Seven of the metros saw lower rates of change, while 3 metros strengthened relative to November. The largest month-to-month relative improvements in the rate of change occurred in San Diego (change from -0.4% to -0.2%, a 0.2% improvement), Denver (change from -0.5% to -0.4%, a 0.1% improvement) and San Francisco (change from -0.8% to -0.7%, a 0.1% improvement). The metros with the largest rates of deceleration were Boston (slowing by 0.3% compared to November) and Las Vegas (with a 0.2% deceleration). Other markets slowed by 10 basis points or less when compared to November’s growth rates.
Note: the major metro areas covered here are the 10 components of the S&P CoreLogic Case-Shiller 10-City Composite Home Price Index. December results are due to be published on February 25th. With this post, RE Metrics is adding its model forecasts for all the markets in 20-City Index (see below).

The Top 20 Markets
The 20-City Index fell by 0.18% in December, according to RE Metrics’ model, reflecting weaker conditions in the rest of the . Monthly price changes were negative in each of the next 10 markets that comprise the 20-city index (see table below).
The largest monthly declines occurred in Tampa (-0.8%), Seattle (-0.6%) and Detroit (-0.6%). Of the 20-City Index components, Tampa is the only market with negative full-year price changes. According to RE Metrics’ estimate, Tampa December 2024 prices stood 0.9% lower than December 2023.

Review of November Predictions
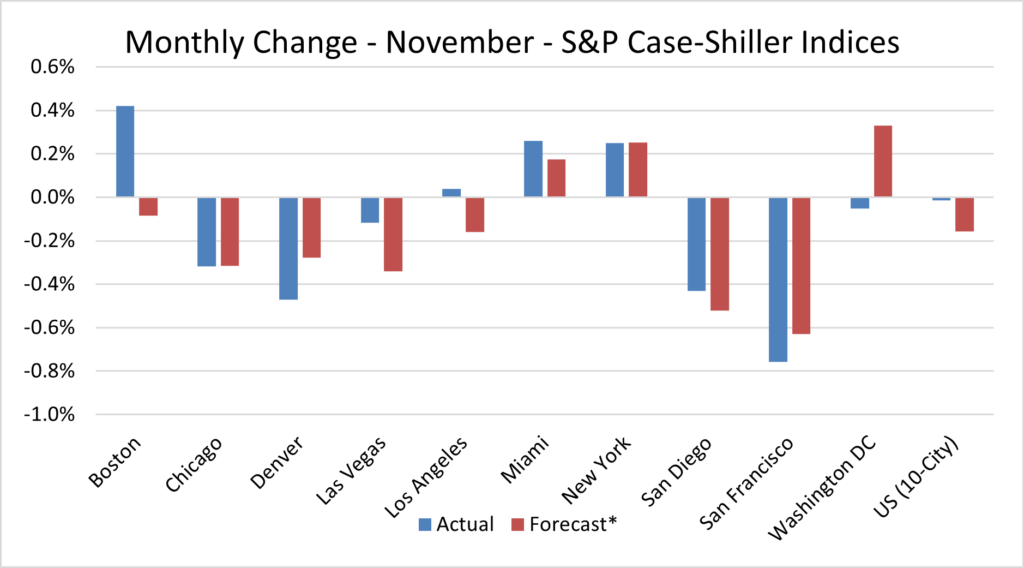
The predicted growth rates for November performed well overall. For the 10-City Composite Index, the forecast was within 15 basis points of the actual (predicted -0.16 % vs. actual -0.02%). At the metro area level, the forecasted growth rates were within 0.1% of the actual result for 5 of the 10 metro areas, and within 0.2% for 8 of the metro areas. The widest spreads between predicted and actual were in Boston (-0.5% spread) and Washington, DC (0.4% spread). See the chart below for comparisons for each metro and the 10-City Composite Home Price Index.


Leave a Reply