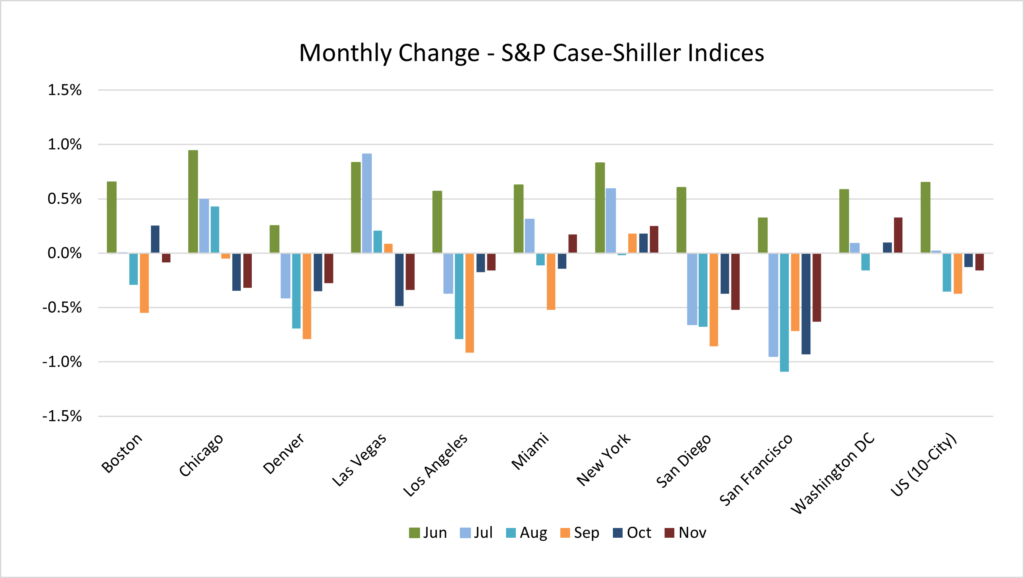
Home prices fell in November, with price declines in several markets outweighing increases in a few markets. RE Metrics’ estimate for November home prices (US 10-City Index) is negative 0.16%, on par with the 0.13% monthly decrease in October. According to RE Metrics’ model, prices declined in eight of the ten metros during October. The largest month-to-month declines were in San Francisco (-0.6%), San Diego (-0.5%) and Las Vegas (-0.3%). Three markets posted price growth: Washington, DC (0.3%), New York (0.3%) and Miami (0.2%) bucked the overall negative trend.
Most metros experienced shallower (less negative) drops in November compared to October. Eight of the metros saw a relative improvement in the rate of change, while 2 metros weakened relative to October. The largest month-to-month relative improvements in the rate of change occurred in Miami (change from -0.1% to +0.2%, a 0.3% improvement), San Francisco (change from -0.9% to -0.6%, a 0.3% improvement) and Washington, DC (change from 0.1% to 0.3%, a 0.2% improvement). The two weakening metros were Boston (which shifted from +0.3% in October to -0.1% in November) and San Diego (which shifted from -0.4% in October to -0.5% in November).
(Note: the major metro areas covered here are the 10 components of the S&P CoreLogic Case-Shiller 10-City Composite Home Price Index. November results are due to be published on January 28th.)

Review of October Predictions
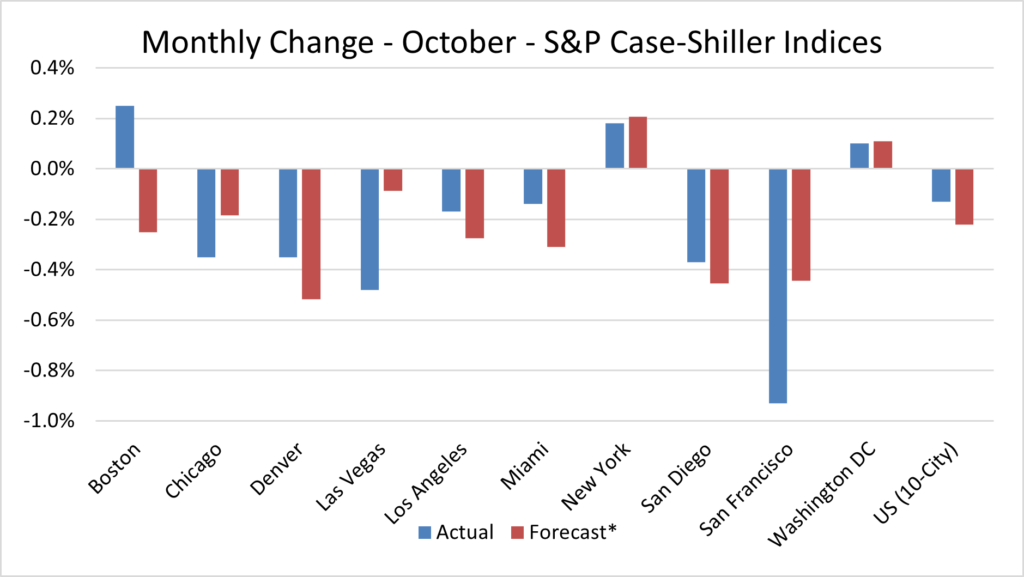
The predicted growth rates for October performed well overall. For the 10-city composite index, the forecast was within 9 basis points of the actual (predicted -0.22% vs. actual -0.13%). At the metro area level, the forecasted growth rates were within 0.1% of the actual result for 4 of the 10 metro areas, and within 0.2% for 7 of the metro areas. The widest spreads between predicted and actual were in Boston (-0.5% spread) and San Francisco (0.5% spread). See the chart below for comparisons for each metro and the 10-City Composite Home Price Index.


Leave a Reply